
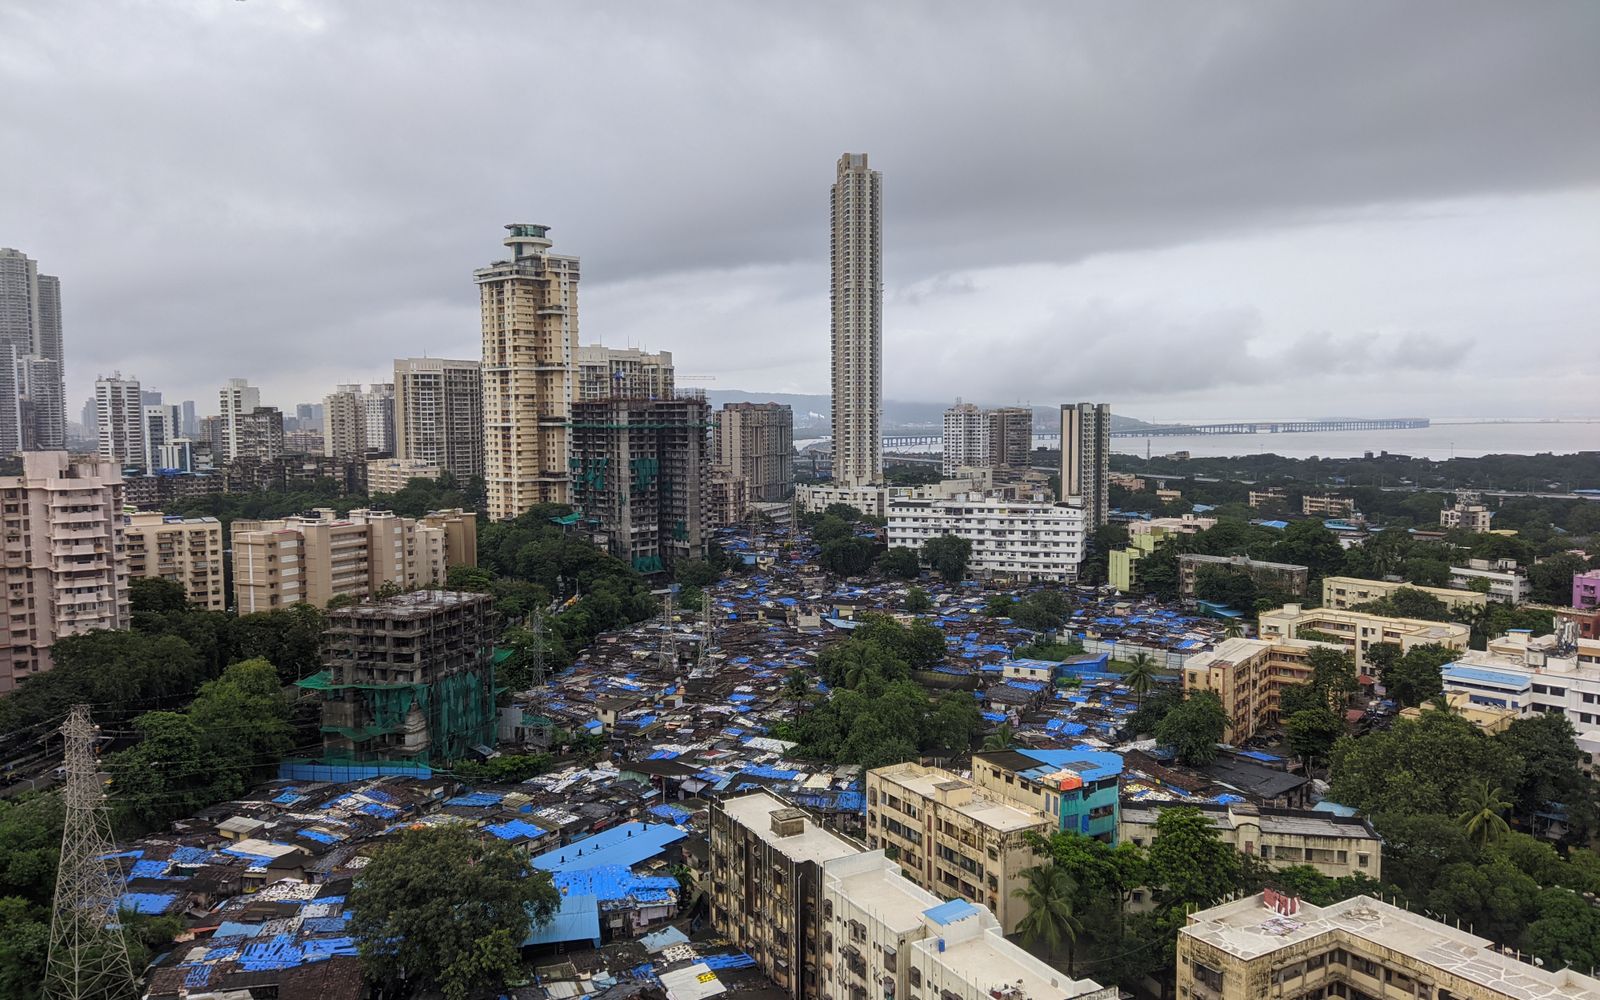
When this month’s “world’s best cities for quality of life 2026” list began circulating in Indian media, the story wrote itself: Canberra first, European cities crowding the top 30, and India’s largest cities nowhere in sight [1]. Dig deeper and it is starker. The list is the quality-of-life pillar of Oxford Economics’ Global Cities Index 2026, and on that pillar Delhi, India’s best-placed city overall at 268th, ranks 781st, and none of India’s highest-ranked cities makes the top 500 [2]. Before planners despair or shrug, they should ask: what exactly is being measured, and for whom?
What this month’s ranking measures
The Global Cities Index scores the world’s 1,000 largest cities on 27 indicators in five categories: economics, human capital, quality of life, environment and governance [3]. India has 91 cities in the 2026 edition, but their average rank is 716 [4]. Delhi’s profile shows why a single number misleads: 13th in the world for human capital and 116th for economics, yet 781st for quality of life and 915th for environment [2].
The quality-of-life pillar itself is narrow. Oxford Economics lists life expectancy, income per person, income equality, housing expenditure, recreation and cultural sites, and internet speed [3]; Visual Capitalist’s summary of the 2026 results adds crime [1]. These are sensible proxies, but they are city-wide figures, and governance is scored nationally, so every city in a country gets the same governance score [3]. Nothing here asks whether residents feel safe walking home, sleep through the night or find shade on a May afternoon.
Five rankings, five different questions
The Economist Intelligence Unit’s Global Liveability Index placed Copenhagen first in 2026, with New Delhi 120th, Mumbai 121st, Chennai 123rd and Bengaluru 127th [5]. Its five categories, stability (25%), healthcare (20%), culture and environment (25%), education (10%) and infrastructure (20%), draw on more than 30 factors, many rated by EIU analysts and in-city contributors [6]. Delhi’s weakest 2026 scores were culture and environment (35.4) and healthcare (41.7) [5]. The EIU is open about its purpose: helping employers set hardship allowances for staff posted abroad [6].
Mercer’s Quality of Living ranking is more explicit still. It assesses “the practicalities of daily life for international assignees and their families” across 241 cities so that multinationals can calibrate pay; in 2024 Hyderabad (150th), Pune (154th), Bengaluru (156th) and Mumbai (158th) were India’s leading entries [7]. Monocle’s annual survey is an editorial judgement that values green space, a sense of community and “the ability to grab a decent meal after 22.00”; Paris won in 2025 [8]. Numbeo is crowd-sourced: a published formula combines user-contributed data on eight factors, from purchasing power and safety to commuting and pollution [9]. In its mid-2026 table, Hyderabad (167.1) and Pune (158.0) lead the Indian entries, Bengaluru (127.3) trails Chennai, and Mumbai and Delhi sit near the foot of the list [10].
| Index | Who publishes | What it measures | Who it’s for |
|---|---|---|---|
| Global Liveability Index | Economist Intelligence Unit | Stability, healthcare, culture & environment, education, infrastructure | Employers setting expatriate allowances |
| Quality of Living | Mercer | Daily practicalities for international assignees | HR and global mobility managers |
| Global Cities Index | Oxford Economics | Economics, human capital, quality of life, environment, governance | Businesses, academics, policymakers |
| Quality of Life Survey | Monocle | Editorial mix of data and lifestyle markers | Magazine readers |
| Quality of Life Index | Numbeo | Crowd-sourced costs, safety, health, traffic, pollution | Website users comparing cities |
| Ease of Living Index | MoHUA, Government of India | Quality of life, economic ability, sustainability, citizen perception | Policymakers and cities in India |
India’s own yardsticks
The Ministry of Housing and Urban Affairs built India’s own tools to guide evidence-based policymaking. The Ease of Living Index 2020 assessed 111 cities on 49 indicators across 13 categories under three pillars, quality of life, economic ability and sustainability, and gave 30% of the weight to a Citizen Perception Survey answered by 32.2 lakh residents [11]. Bengaluru topped the million-plus category (66.70), ahead of Pune and Ahmedabad, while Shimla led the smaller cities. The companion Municipal Performance Index scored 111 municipalities on 100 indicators across five verticals, with Indore on top [11].
Set side by side, the rankings disagree. Bengaluru is India’s most liveable large city on the government’s index, yet sits behind Delhi, Mumbai and Chennai in the EIU’s 2026 list and behind Hyderabad and Pune for Mercer and Numbeo [5, 7, 10, 11]. That is not a scandal; each index answers a different question. The larger problem is age: the 2020 edition, released in March 2021, rests on a survey fielded in early 2020, before the pandemic changed how people work, travel and use public space [11].
What the rankings miss
Whose city? The EIU and Mercer exist largely to price relocation. The EIU’s indicators include international links, private education and healthcare, consumer goods and the “discomfort of climate for travellers”, describing the city a newly arrived professional experiences [6]. A domestic worker commuting two hours from the periphery lives in a different city with the same name.
Averages hide the margins. According to Census 2011, 6.54 crore Indians lived in slums, 17.4% of the urban population [12]. A city-wide score cannot show the gap between a gated enclave and a basti a kilometre away. The base data are dated, too: the 2021 Census was postponed because of COVID-19, and enumeration for Census 2027 has a reference date of 1 March 2027 [13]. Until then, ward-level planning rests on fifteen-year-old figures.
Residents’ minds. None of the global liveability rankings asks residents how satisfied they are with their own lives. When the World Happiness Report 2020 ranked 186 cities by residents’ own life evaluations, New Delhi came seventh from the bottom [14], a signal invisible in liveability scores (see our World Happiness Report 2025 summary). A stakeholder investigation by Sarkar and Pujara, with 201 respondents, examined 49 physical and 12 social indicators of the urban environment in relation to mental well-being [15], a far wider canvas than any quality-of-life pillar.
The night, the heat and the noise. Global rankings say almost nothing about traffic noise at 2 a.m., overheated tin-roofed rooms or the walk to the nearest tree. Climate enters the EIU index through traveller discomfort rather than residents’ heat exposure [6]. Yet sleep quality is an urban health indicator in its own right, shaped by noise, heat and housing.
Weights are choices. The EIU fixes its weights; Numbeo calls its formula “empirical” and notes that it has changed over time [9]. The OECD’s Better Life Index instead lets users weight its topics themselves [16]. Weights can also be derived systematically with stakeholders, as in Sarkar and Pujara’s assessment framework for India, built with the nominal group technique and the rank order centroid method [17]. A ranking is only as defensible as the weights it publishes.
Better ways to measure a city
Well-being frameworks already exist. The Better Life Index covers 11 topics, from housing and jobs to community, life satisfaction and work-life balance, but works at national level because most indicators are unavailable at finer scales [16]. The World Health Organization offers a different philosophy: “A healthy city is defined by a process, not an outcome” [18]. That shifts attention from rank to trajectory.
For Indian cities, the missing piece is a framework linking measurable environmental features to how people feel. Sarkar and Pujara’s conceptual framework maps urban environment indicators to mental well-being [19], and their Delhi case study explores the link between perceived urban environments and mental well-being [20]. Together with ideas for embedding happiness in India’s master plans, such work points towards indices that combine objective data with residents’ perceptions, neighbourhood by neighbourhood.
Using rankings wisely: six recommendations
1. Read the question before the rank. An index built to price expatriate allowances or guide investors is not a verdict on residents’ lives. Quote it for what it was designed to show.
2. Use the sub-scores, not the headline. Delhi’s pillar ranks [2] say more about where to act than its 268th place overall. Pillar scores are diagnostic; composite ranks are publicity.
3. Bring the index down to the ward. City averages bury informal settlements. Report indicators by ward and income group so that gaps become visible and budgets can follow (see our piece on data-driven, health-centric planning).
4. Keep residents’ voices at the centre. The Ease of Living Index was right to give citizen perception 30% of the weight [11]. The next step is a regular, ward-level survey covering mental well-being, safety and belonging.
5. Measure the night, the heat and the shade. Sleep quality, night-time noise, indoor heat, tree canopy and walking distance to usable green space belong in any Indian index; they shape daily health far more than international flight links do.
6. Publish the weights and refresh on a timetable. Methods, weights and raw data should be open, with editions on a fixed cycle tied to Census 2027 releases, so cities can track change rather than argue over one-off ranks.
A better Indian city index would measure distribution rather than averages, pair objective indicators with residents’ perceptions, give mental well-being, sleep, heat and green space a formal place, and set its weights openly with stakeholders. Global rankings will keep making headlines. Indian planners should read them, learn from the sub-scores, and then measure the city their own residents live in.
References
1. Venditti, B. (2026, 8 October). Ranked: The world’s best cities for quality of life in 2026. Visual Capitalist. visualcapitalist.com
2. The CSR Journal. (2026, 13 October). Indian cities rank low in Global Quality of Life Index; Delhi placed 268th overall, 781st in standards. The CSR Journal. thecsrjournal.in
3. Oxford Economics. (2024). Global Cities Index 2024 (methodology). Oxford Economics. oxfordeconomics.com
4. Economic and Political Weekly. (2026). For more and better cities [Editorial]. Economic and Political Weekly, 61(40). epw.in
5. Das, S. (2026, 10 July). Global Liveability Index 2026: Delhi ranks 120, Mumbai at 121; why are Indian cities lagging behind despite job growth? The Daily Jagran. thedailyjagran.com
6. Economist Intelligence Unit. (2022). The Global Liveability Index 2022: Recovery and hardship. EIU. EIU free report (PDF)
7. Mercer. (2024). Quality of Living City Ranking 2024. Mercer. mercer.com
8. Sipp, T. (2026, 22 June). The Monocle Quality of Life Survey’s top cities throughout the past decade. Monocle. monocle.com
9. Numbeo. (n.d.). Understanding Quality of Life Indexes. Numbeo. numbeo.com
10. Numbeo. (2026). Quality of Life Index by City 2026 Mid-Year. Numbeo. numbeo.com
11. Press Information Bureau. (2021, 4 March). Bengaluru, Pune, Ahmedabad best cities in EoLI 2020 (Million Plus Category). Ministry of Housing and Urban Affairs, Government of India. pib.gov.in
12. Lok Sabha. (2023, 27 July). Increase in number of slums in the country (Unstarred Question No. 1202). Ministry of Housing and Urban Affairs. eparlib.nic.in
13. Joy, S. (2026, 7 January). ‘Houselisting’, first phase of Census 2027 to take place between April–September: Ministry of Home Affairs. Deccan Herald. deccanherald.com
14. De Neve, J.-E., & Krekel, C. (2020). Cities and happiness: A global ranking and analysis. In World Happiness Report 2020 (Chapter 3). worldhappiness.report
15. Sarkar, A., & Pujara, T. (2025). Perceptions of urban environment indicators associated with mental well-being: A stakeholder investigation. Cities & Health, 9(2), 273–297. https://doi.org/10.1080/23748834.2025.2480480
16. OECD. (n.d.). What’s the Better Life Index? OECD Better Life Index. oecdbetterlifeindex.org
17. Sarkar, A., & Pujara, T. (2024). Development of an urban environment assessment framework for mental well-being in India using nominal group technique and rank order centroid method. Cities & Health, 9(1), 90–111. https://doi.org/10.1080/23748834.2024.2436708
18. WHO Regional Office for Europe. (n.d.). What is a healthy city? World Health Organization. who.int
19. Sarkar, A., & Pujara, T. (2025). A conceptual framework for mapping urban environment indicators and mental well-being. Discover Cities, 2(1), 119. https://doi.org/10.1007/s44327-025-00166-z
20. Sarkar, A., & Pujara, T. (2025). Exploring the link between perceived urban environments and mental well-being: A case study of Delhi, India. Cities & Health, 9(2), 226–247. https://doi.org/10.1080/23748834.2025.2457847
Cover image: Mumbai’s skyline, where high-rise towers stand beside dense older settlements. Photo by Rafijul Momin on Pexels.
Write for UFI
Have a story about cities? We publish articles and photo essays from researchers, practitioners and photographers.
Pitch us at contact@urbanfrontierinsights.com