
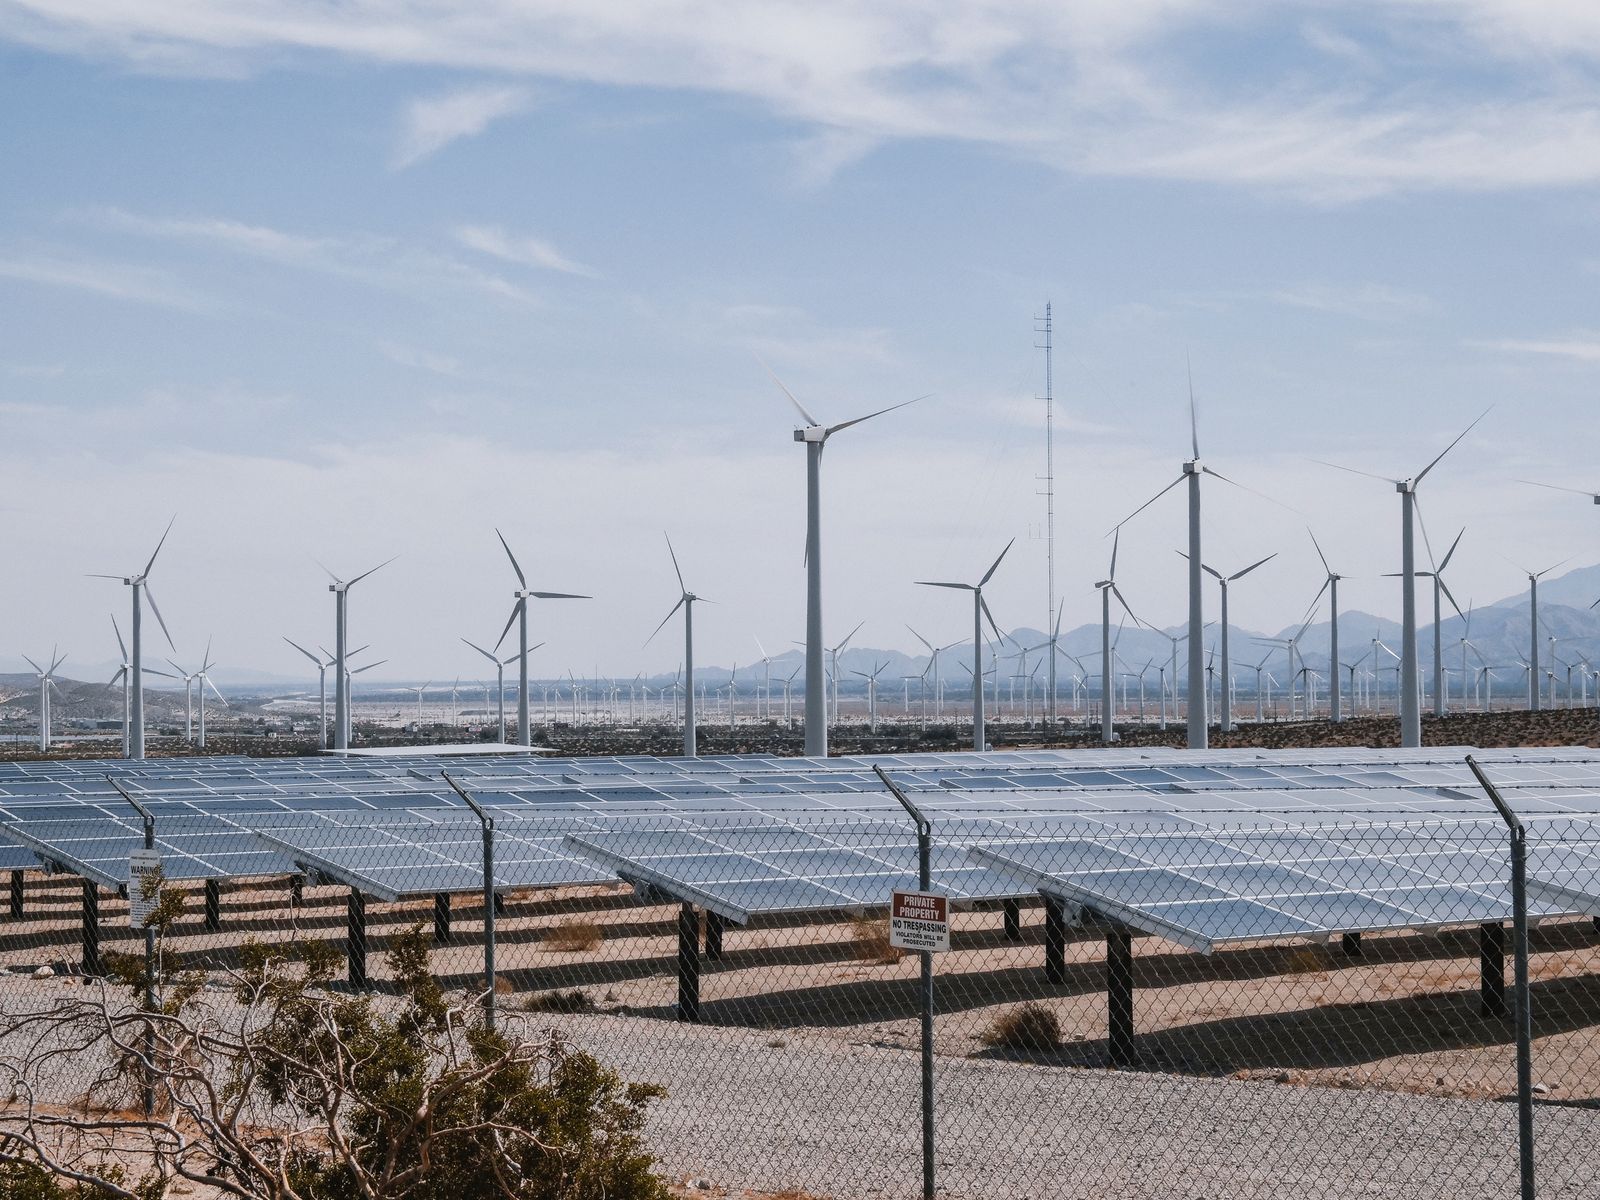
The world has never produced, or burned, more energy than it does today. Global energy supply grew by around 2% in 2024, and records fell on both sides of the ledger: oil demand crossed 101 million barrels per day for the first time, coal consumption reached an all-time high of 165 exajoules, and energy-related emissions touched a record 40.8 GtCO2e [1]. With the energy system responsible for roughly three-quarters of global greenhouse-gas emissions [2], where demand and supply head next is the defining question of climate policy.
Where demand is heading
The clearest signal is electrification. Electricity demand rose 4% in 2024, roughly twice the pace of energy use overall [1][3]. The International Energy Agency’s World Energy Outlook 2025 expects this to accelerate: global electricity demand grows by almost 1,000 TWh every year to 2035 — approximately a Japan’s worth of new consumption annually — with peak demand up around 40% by 2035 [4]. The drivers are air conditioning and appliances in fast-growing economies, industry, electric vehicles and data centres: computing alone is projected to more than double its electricity use from about 415 TWh in 2024 to around 945 TWh by 2030 [5]. Most of the coming decade’s growth will come from emerging economies, where rising incomes, urbanisation and cooling needs climb together [4]. Yet the demand story remains deeply unequal — about 666 million people still live without electricity, and the world is off track for universal access by 2030 [6].
Electricity use by data centres, actual and projected (TWh)
The supply response
Supply is changing structurally rather than just growing. A record 585 GW of renewable capacity was added in 2024 — 92.5% of all new power capacity installed worldwide [7] — with solar alone contributing 452 GW and reaching 1,865 GW cumulatively [8]. In generation terms, renewables added a record 858 TWh, and low-carbon sources (renewables plus nuclear) crossed 40% of global electricity for the first time since the 1940s; solar has been the fastest-growing source of power for twenty consecutive years [3]. On stated policies, the IEA projects renewables approaching 55% of global generation by 2035 [4]. The geography, however, is lopsided: Asia took 72% of 2024 additions, and China is expected to account for 45–60% of global renewable deployment over the coming decade [4][8].
New power-generating capacity added worldwide, 2024 (GW)
Renewable Non-renewable
Fossil supply, meanwhile, is consolidating eastward. Eighty-three per cent of the world’s record coal consumption now occurs in the Asia-Pacific, even as European coal use fell 7%, while natural gas production reached 4,124 billion cubic metres [1].
Closing the gap: production and consumption
At COP28, governments agreed to triple renewable capacity to about 11.2 TW and to double the rate of energy-efficiency improvement by 2030 [9]. The world is close but not on course: capacity grew 15.1% in 2024 against the 16.6% a year the target requires, a shortfall of roughly 0.8 TW by 2030 at current pace — though the surge of additions in 2025 has brought tripling within reach if momentum holds [8][10]. The arithmetic remains unforgiving: wind and solar met only 53% of last year’s increase in generation, so demand growth still outran clean supply — every avoided kilowatt-hour matters as much as every added panel [1]. On the production side, the binding constraints are no longer panels and turbines but grids, storage and finance: transmission queues, the integration of variable supply, firm low-carbon complements such as hydro, geothermal and nuclear, and the cost of capital in developing economies. On the consumption side, the cheapest kilowatt-hour remains the one never used: stringent efficiency standards for cooling — which could otherwise add nearly 1,500 TWh of demand by 2035 [4] — electrified transport and heating, demand response, and compact, well-designed cities that need less energy to deliver the same quality of life.
Conclusion
The world is heading into an electric age in which demand rises faster than at any point in decades, clean supply breaks records annually, and fossil fuels nonetheless sit at historic highs. The race, in short, is between electrification and decarbonisation. Whether 2024’s record emissions prove to be a peak or merely a plateau will be decided by the grids built, the standards set and the finance mobilised in this decade.
References
1. Energy Institute. Statistical Review of World Energy 2025. London: Energy Institute, 2025. energyinst.org/statistical-review
2. IPCC. Climate Change 2022: Mitigation of Climate Change. Working Group III Contribution to the Sixth Assessment Report. Cambridge: Cambridge University Press, 2022. ipcc.ch/report/ar6/wg3
3. Ember. Global Electricity Review 2025. London: Ember, 2025. ember-energy.org
4. International Energy Agency. World Energy Outlook 2025. Paris: IEA, 2025. iea.org/reports/world-energy-outlook-2025
5. International Energy Agency. Energy and AI. Paris: IEA, 2025. iea.org/reports/energy-and-ai
6. IEA, IRENA, UNSD, World Bank and WHO. Tracking SDG 7: The Energy Progress Report 2025. Washington, DC: World Bank, 2025. irena.org
7. IRENA. Renewable Capacity Statistics 2025. Abu Dhabi: International Renewable Energy Agency, 2025. irena.org
8. IRENA. “Renewables in 2024: 5 Key Facts Behind a Record-Breaking Year.” April 2025. irena.org
9. UNFCCC. “Outcome of the First Global Stocktake.” Decision 1/CMA.5, COP28, Dubai, December 2023. unfccc.int
10. Ember. “Renewable Additions in 2025 Are Once Again Expected to Surge, Putting Tripling Within Reach.” London: Ember, 2025. ember-energy.org
Cover image: Kindel Media / Pexels.
Write for UFI
Have a story about cities? We publish articles and photo essays from researchers, practitioners and photographers.
Pitch us at contact@urbanfrontierinsights.com