
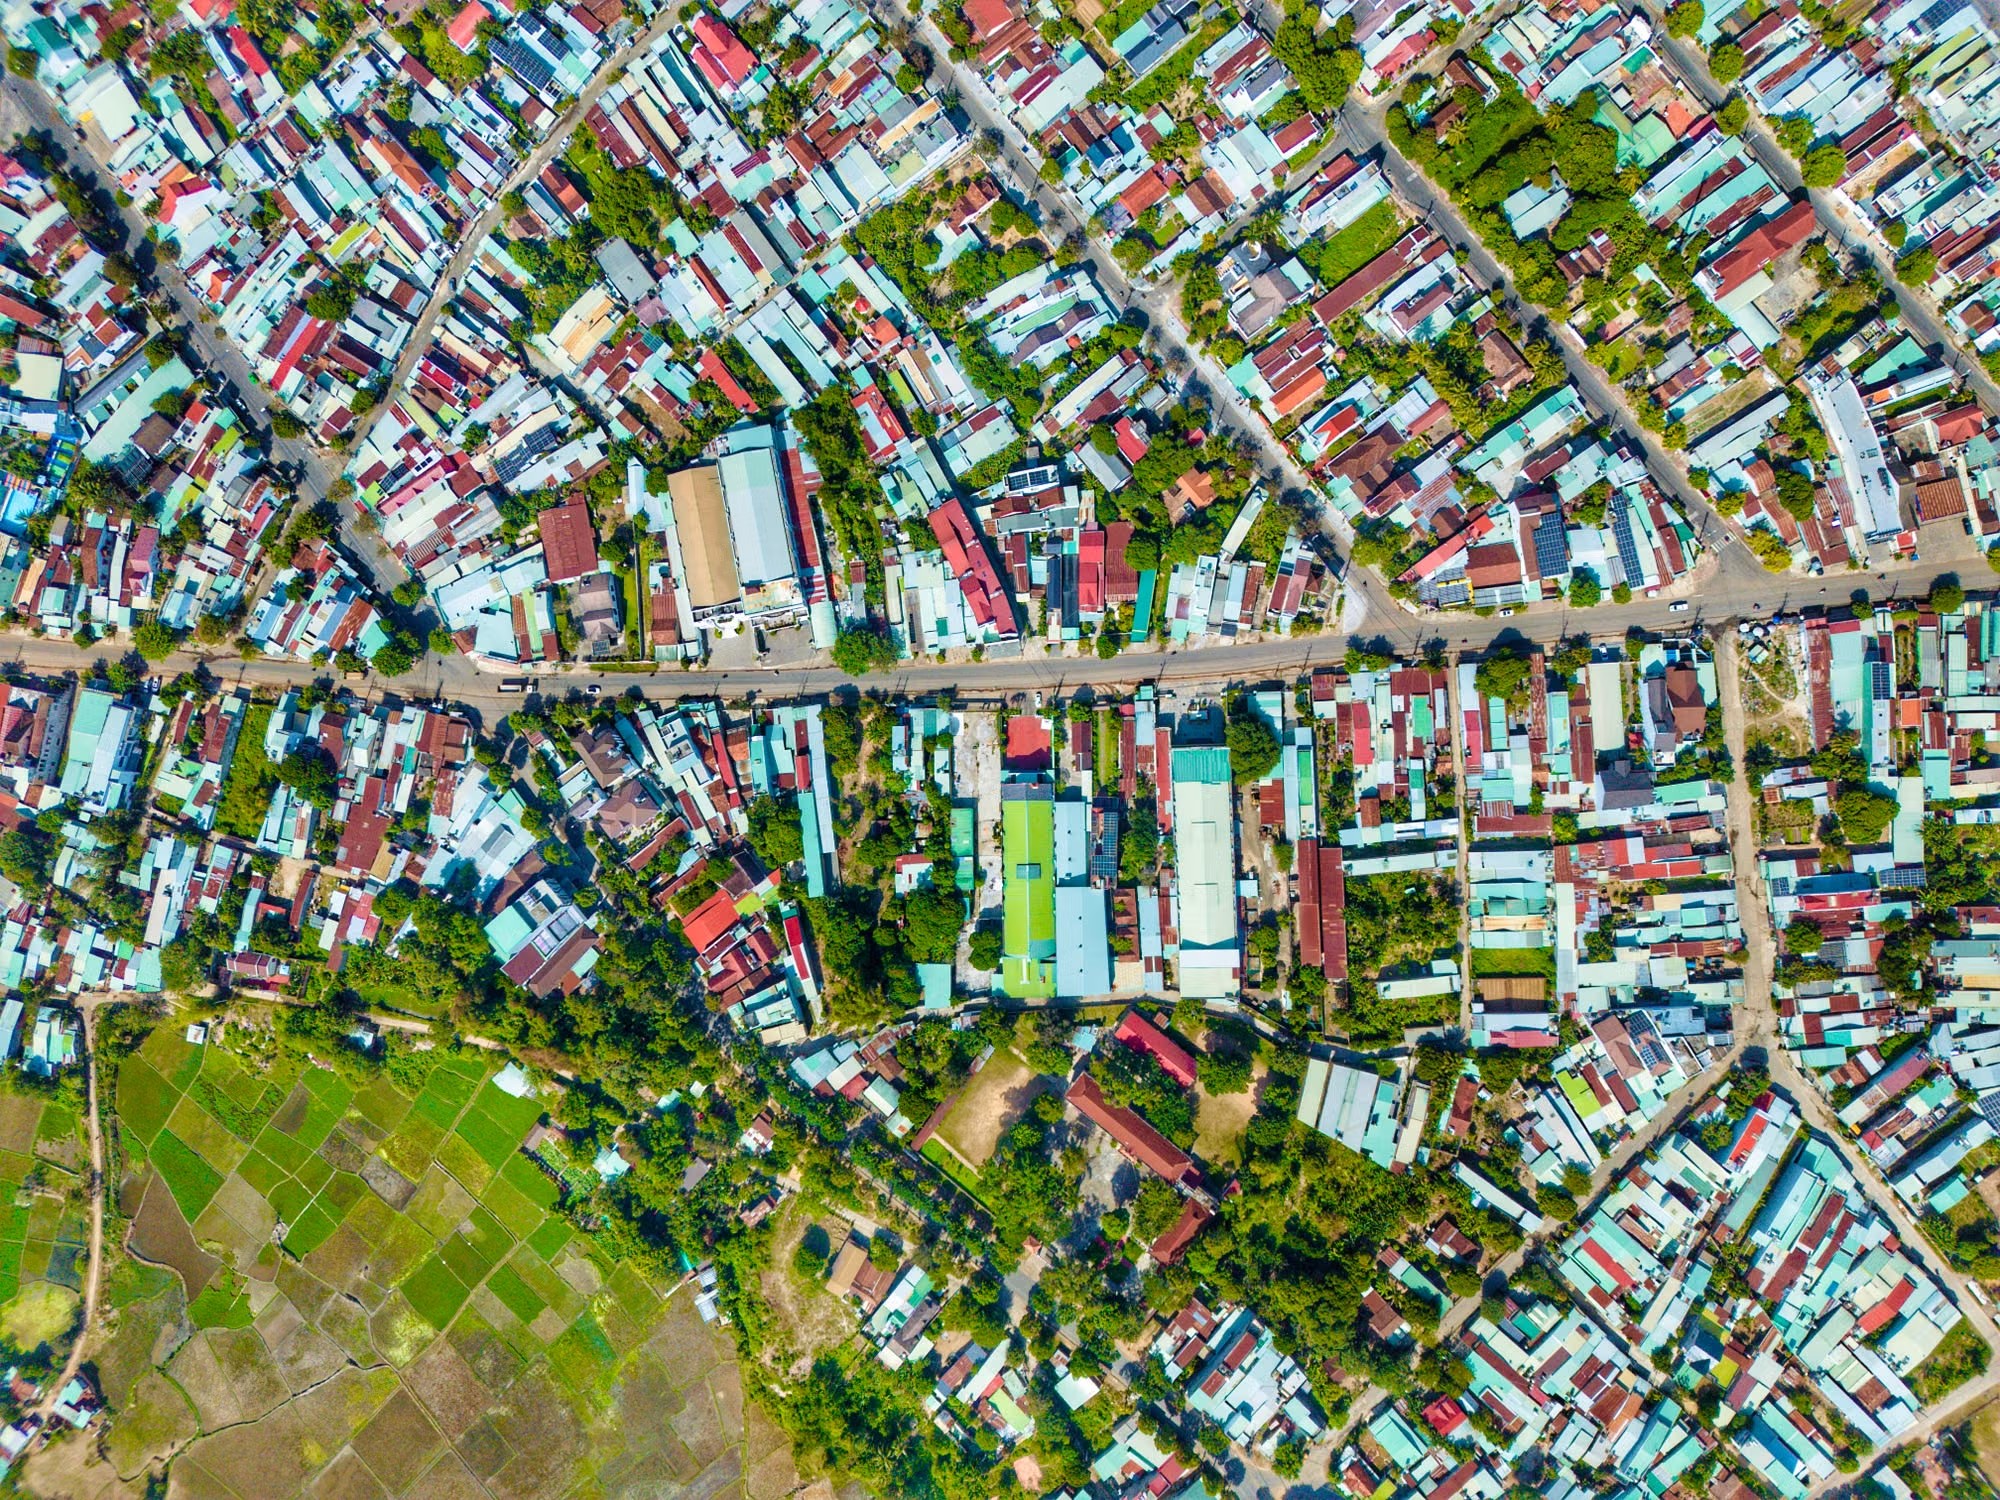
Photo: Aerial view of a dense, colourful urban neighbourhood with greenery. Credit: Duy Nguyen via Pexels.
Most master plans are, at heart, maps. They show land use, road widths, densities and the sites reserved for schools, parks and hospitals. What they rarely show is how healthy the people living on that land actually are, where illness clusters, or where residents feel anxious, unsafe or content. Yet more than a billion people now live with a mental health condition [1], and unhealthy environments were linked to 12.6 million deaths in 2012 alone [2]. With around 70 per cent of humanity expected to live in cities by 2050, and an estimated 75 per cent of the infrastructure needed by then still unbuilt [2], the plans drawn today will shape public health for generations.
That is the case for a health-based master plan: a plan that treats health not as one land-use category among many, but as a layer that runs through every decision. And the tool that makes such a plan possible is the map itself, extended from roads and plots to disease, access to care, mental wellbeing and even emotion.
A very old idea: disease has an address
The link between maps and public health is older than modern planning. In late August 1854, cholera tore through Soho in London and killed hundreds of people within days. The physician John Snow plotted each death as a small mark on a street map and found that the cases clustered around a single public water pump on Broad Street. He presented his evidence to the local Board of Guardians on 7 September, and the pump was shut down the next day [3].
Snow’s map made a simple but radical point: illness is spatial. It has a location, a pattern and, very often, an environmental cause that a city can change. More than 170 years later, geographic information systems (GIS) let planners do what Snow did by hand, but across whole cities and with many more layers of data.
Mapping illness and access to care
The first layer of a health-based plan is the familiar one: where disease occurs. Ward-level maps of dengue, tuberculosis, diarrhoeal disease, diabetes or respiratory illness reveal hotspots that citywide averages hide. When these are overlaid with maps of drainage, waste collection, air quality, heat and flooding, the environmental drivers of illness become visible, and so do the places where a planning intervention would do the most good.
The second layer is healthcare infrastructure. Plans often allocate hospital and dispensary sites by population norms, but a plot on a map is not the same as access. GIS can measure travel time to the nearest primary health centre on foot or by public transport, show which neighbourhoods lie outside reasonable reach of emergency care, and compare the distribution of clinics, beds and pharmacies with where illness actually concentrates.
Mapping access at a global scale shows how large these gaps are. A 2020 study in Nature Medicine combined road networks, terrain and the locations of health facilities to map travel time to care for the whole planet. It found that 8.9 per cent of the world’s population, about 646 million people, cannot reach a healthcare facility within one hour even with motorised transport, and that 43.3 per cent, about 3.16 billion people, cannot do so within an hour on foot [4]. Maps like these turn access from an assumption into a measurable gap that a master plan can be held to.
Mapping what clinics cannot see: mental health and subjective data
Mental health is much harder to map. Clinical records are sparse, stigma keeps many people from seeking help, and governments spend a median of just 2 per cent of their health budgets on mental health [1]. A map of diagnoses would show mostly where services exist, not where distress lies.
Planners are therefore turning to subjective data: what residents themselves report about the places they live in. Public participation GIS invites people to mark a map with places they love, avoid, find stressful or feel unsafe in. Helsinki used this approach for its municipal master plan. An online map-based survey drew 4,700 respondents, who added 33,000 ideas and reactions within one month [5]. Data like this captures something no hospital register can: how a neighbourhood feels to the people who use it every day.
Emotional and happiness mapping
Some researchers have gone further and tried to map emotion directly. In his Bio Mapping project, the artist Christian Nold gave participants a device that combined GPS with a galvanic skin response sensor worn as finger cuffs, sampling their physiological arousal every four seconds as they walked through a neighbourhood [6]. The resulting “emotion maps”, including one of Greenwich in London developed through workshops in 2005 and 2006, showed the city as a landscape of calm and agitation rather than of streets and buildings.
Happiness can be mapped at scale too. The Mappiness study asked more than 20,000 smartphone users in the UK, at random moments, how happy they felt and where they were. From over one million responses, it found that people were significantly and substantially happier outdoors in all green or natural settings than in urban environments, with marine and coastal locations scoring highest [7][8]. For planners, findings like these turn “green space” from an amenity into a measurable contributor to wellbeing.
From maps to master plans
Maps matter only when they change decisions. Barcelona offers a clear example of health evidence shaping urban design. A health impact study of the city’s original plan for 503 “superblocks”, which reclaim streets from traffic for people and greenery, estimated that the full plan could prevent 667 premature deaths every year, mainly through lower air pollution, traffic noise and heat, and save around 1.7 billion euros annually [9]. Health, in other words, was modelled spatially and used to argue for a planning choice.
A health-based master plan would make this routine. It would bring together several layers of evidence, each answering a different planning question:
| Map layer | What it shows | Typical data | Planning use |
|---|---|---|---|
| Disease mapping | Where illness clusters | Ward-level case data, surveillance records | Target drainage, sanitation, housing and heat action |
| Healthcare infrastructure | Who can reach care, and how quickly | Facility locations, beds, travel-time analysis | Site new clinics and transport links where gaps are largest |
| Environmental exposure | Air, noise, heat and flood risk | Sensors, satellite data, climate models | Set land-use, green cover and building controls |
| Mental health and subjective data | Where people feel stressed, unsafe or isolated | Participatory GIS, surveys, community mapping | Design safer streets, public spaces and services |
| Emotion and happiness mapping | Where people feel calm, joyful or anxious | Experience sampling apps, wearable sensors | Protect and extend restorative places, especially green and blue spaces |
The cautions
Health maps carry real risks. Disease and mental health data are among the most sensitive information a city can hold, and maps can reveal more than intended when data are fine-grained. Labelling a neighbourhood as a “mental illness hotspot” can deepen stigma, lower property values and push away the very investment it needs. Subjective and app-based data also come with bias: they over-represent people who own smartphones, have time to respond and feel confident sharing their views, and they can miss older residents, informal workers and the urban poor.
These risks argue for care, not abandonment. Health layers should use aggregated, anonymised data, combine digital tools with on-the-ground community mapping, and be governed by clear rules on consent and use. Above all, a map must lead to action. A dashboard that records distress without changing budgets, services or design is surveillance, not planning.
Planning cities that make people well
For cities everywhere, and especially for the fast-growing cities of Asia, Africa and Latin America, the opportunity is large. Master plans are revised every decade or two, and each revision is a chance to add a health layer: ward-level disease and access maps, environmental exposure maps, and regular, carefully designed surveys of how residents feel about where they live. These need not wait for perfect data. Snow worked with a street map and a list of deaths.
The WHO and UN-Habitat put the underlying question bluntly when they launched their sourcebook on integrating health into urban planning: “If the purpose of urban planning is not for human health, then what is it for?” [2]. Mapping illness, care, emotion and happiness is how a city starts to answer it.
Connect with the author, Asesh Sarkar, on LinkedIn, and follow Urban Frontier Insights on LinkedIn.
References
1. World Health Organization. (2025, 2 September). Over a billion people living with mental health conditions – services require urgent scale-up. paho.org
2. World Health Organization. (2020, 21 May). Urban planning crucial for better public health in cities [launch of Integrating Health in Urban and Territorial Planning: A Sourcebook, WHO and UN-Habitat]. who.int
3. Linda Hall Library. Scientist of the Day: John Snow. lindahall.org
4. Weiss, D. J., et al. (2020). Global maps of travel time to healthcare facilities. Nature Medicine, 26, 1835–1838. epfl.ch
5. Nordregio. Maptionnaire: a digital tool for participatory planning. nordregio.org
6. King’s College London, 3DVisA. (2006). Bio Mapping: interview with Christian Nold. kcl.ac.uk
7. MacKerron, G., & Mourato, S. (2013). Happiness is greater in natural environments. Global Environmental Change, 23(5), 992–1000. lse.ac.uk
8. University of Sussex. (2013). App shows people really do like to be beside the seaside. sussex.ac.uk
9. ISGlobal. (2019). The original superblocks project could prevent almost 700 premature deaths every year in Barcelona [Mueller, N., et al., Environment International]. isglobal.org
Write for UFI
Have a story about cities? We publish articles and photo essays from researchers, practitioners and photographers.
Pitch us at contact@urbanfrontierinsights.com