
Cities measure almost everything: traffic speeds, air quality, property prices, footfall in markets. Very few measure whether their residents sleep. Yet sleep is where much of urban life finally lands, in the body. A flyover roaring at 2 a.m., a bedroom that stays at 31°C long after sunset, a two-hour commute, a late dinner eaten in front of a phone: each leaves a trace on how well people rest. Poor rest then shows up as heart disease, depression, accidents and lost productivity. If healthy cities are the goal, sleep may be one of the most honest indicators we have.
Why sleep belongs on the urban health dashboard
Sleep is no longer a lifestyle footnote. In 2022 the American Heart Association added sleep as the eighth metric of cardiovascular health in its Life’s Essential 8 framework, alongside diet, physical activity, nicotine, body weight, blood lipids, blood glucose and blood pressure [1]. Expert consensus recommends seven to nine hours a night for most adults [2]. A meta-analysis of 16 prospective studies covering about 1.38 million people found that short sleepers had a 12% higher risk of death, and long sleepers a 30% higher risk, than people sleeping the recommended amount [3].
The problem is not abstract for Indian cities. In a 2024 LocalCircles survey, 61% of respondents said they got less than six hours of uninterrupted sleep, up from 50% in 2022 [4].
What makes sleep useful as an indicator is that it has several dimensions. Sleep researcher Daniel Buysse proposed defining sleep health through satisfaction, daytime alertness, timing, efficiency and duration, each measurable with simple self-reports or objective devices [5]. That makes sleep something a city survey can actually track. It also captures many exposures at once. Our own work on urban environments and mental well-being, including a stakeholder investigation of 201 respondents covering 49 physical and 12 social indicators of the urban environment [6], shows how many features of a city bear on how people feel, from housing and green space to safety and social ties [7]. Sleep, closely bound up with mental well-being, is one outcome where many of these features meet.
The city at night: what keeps people awake
Noise. The World Health Organization recommends keeping night-time road traffic noise below 45 dB Lnight, railway noise below 44 dB and aircraft noise below 40 dB [8]. The systematic review behind those guidelines found that each 10 dB rise in night-time road noise roughly doubled the odds of people reporting that noise left them highly sleep-disturbed [9]. In dense cities, where homes sit beside arterial roads, rail lines and late-night construction, these thresholds are easily crossed (see our piece on urban noise and stress).
Light. More than 80% of the world’s population lives under light-polluted skies; in the United States and Europe the figure is 99% [10]. Indoors, screens add to the glow. In a controlled study, reading on a light-emitting e-reader before bed delayed sleep, suppressed melatonin, shifted the body clock later and reduced next-morning alertness compared with reading a printed book [11].
Heat. Using about seven million nights of wristband data from more than 47,000 adults in 68 countries, Minor and colleagues found that nights above 30°C cut sleep by just over 14 minutes on average. Losses were larger in lower-income countries, among older adults and among women, and the authors projected that by 2099 warming could cost each person 50 to 58 hours of sleep a year [12]. Urban heat islands keep cities warm after dark, which puts city dwellers in poorly ventilated homes on the front line (more on extreme heat and health).
Safety and disorder. Sleep is also social. In a survey of 1,504 adults in Texas, people who perceived more disorder in their neighbourhood slept worse, and poor sleep partly explained their higher psychological distress [13].
Green space. On the positive side, a systematic review found that 11 of 13 studies linked more exposure to green space with better sleep quality and quantity, and pointed to walking programmes, gardening and time in forests as possible interventions [14]. This connects to our recent work on green space and loneliness [15]: parks that bring people together by day may also help them rest at night.
Lifestyle, work and food: the city inside the body
Urban schedules rarely follow the body clock. Chronobiologist Till Roenneberg and colleagues call the gap between biological time and social time “social jetlag”, and found it associated with higher body mass index, especially among people who were already overweight [16]. Long commutes, night shifts, call-centre work across time zones and app-based delivery work all push sleep later or break it into pieces.
Food is part of the same story. A review by Marie-Pierre St-Onge and colleagues found that changes in carbohydrate and fat intake can alter deep (slow-wave) and REM sleep, and that foods such as milk, fatty fish, tart cherry juice and kiwifruit show early but promising evidence for better sleep [17]. In a separate controlled-feeding study, eating more fibre predicted more deep sleep, more saturated fat predicted less, and more sugar was linked with more night-time awakenings [18]. Cities shape these choices through what is cheap, nearby and open late: food delivery at midnight, a dinner eaten at 10 or 11 p.m. after a long commute, and cups of tea or coffee to get through a double shift. That is one more reason urban food systems belong in health planning.
Measuring sleep: what numbers can tell us
Quantitative research gives cities scale and comparability. The Pittsburgh Sleep Quality Index (PSQI), a 19-item questionnaire covering seven components, remains the most widely used tool; a global score above 5 signals poor sleep [19]. Wrist actigraphy and consumer wearables add objective data on duration, timing and fragmentation over weeks or months, as the global heat study shows [12]. When these sleep measures are linked through GIS to night-time noise maps, satellite light data, land-surface temperature and greenness indices, researchers can map where in a city sleep is poorest and test which exposures matter most. This is the evidence planners need for setting targets.
Listening to sleep: what stories can tell us
Numbers show where and how much; they rarely show why. Qualitative methods fill that gap. In-depth interviews and sleep diaries capture what actually breaks a night: a neighbour’s generator, barking dogs, water supply that arrives before dawn, a shared room in a crowded home, or worry about the late walk back from the bus stop. Photovoice, in which residents photograph the conditions that shape their health and discuss them in groups, turns those experiences into evidence for decision-makers [20]. Walking interviews, conversations held while moving through a neighbourhood, tie those accounts to specific places [21]. These methods also reveal coping strategies, such as sleeping on rooftops in summer, that a wristband would record only as “time in bed”.
The strongest designs combine both. A city could add a short PSQI-based module to its household health survey to find hotspots, then run interviews, diaries and night walks in those neighbourhoods to understand causes, and finally co-design solutions with residents. Mixed methods are not new to urban health research. Our Delhi case study explored how residents’ perceptions of their surroundings relate to their mental well-being [22], and our assessment framework for India combined expert group discussion with quantitative ranking of indicators [23]. The same approach can put sleep on a city’s list of priorities.
From evidence to healthy-city goals
The WHO Healthy Cities network’s Copenhagen Consensus of Mayors (2018) framed its goals around people, participation, prosperity, peace, planet and place [24]. Sleep touches every one of them. Seven practical steps follow:
1. Count it. Add a short, validated sleep module to city health surveys and report the results by ward, income and gender.
2. Plan for quiet nights. Adopt WHO night-noise targets in master plans and building codes, buffer bedrooms from arterial roads and rail lines, and enforce quiet hours on construction.
3. Design light, not glare. Use shielded, warm-coloured, dimmable streetlights that keep streets safe without flooding bedrooms.
4. Cool the night. Expand tree cover, cool roofs and cross-ventilation in affordable housing, since warm nights hit the poorest homes hardest.
5. Bring green space close. Put a park or green street within a short walk of every home.
6. Shape the daily clock. Cut long commutes through mixed land use and better transit, and consider rest in labour policies for shift and platform workers.
7. Listen at night. Make night audits with residents a routine part of neighbourhood planning.
A city that lets its people sleep is a city that is working. Sleep is cheap to measure, sensitive to the built environment and meaningful to residents. Placing it next to air quality and traffic on the urban dashboard would give planners a nightly report card on whether their decisions are making life healthier.
References
1. Lloyd-Jones, D. M., Allen, N. B., Anderson, C. A. M., et al. (2022). Life’s Essential 8: Updating and enhancing the American Heart Association’s construct of cardiovascular health. Circulation, 146(5), e18–e43. https://doi.org/10.1161/CIR.0000000000001078
2. Hirshkowitz, M., Whiton, K., Albert, S. M., et al. (2015). National Sleep Foundation’s sleep time duration recommendations: Methodology and results summary. Sleep Health, 1(1), 40–43. https://doi.org/10.1016/j.sleh.2014.12.010
3. Cappuccio, F. P., D’Elia, L., Strazzullo, P., & Miller, M. A. (2010). Sleep duration and all-cause mortality: A systematic review and meta-analysis of prospective studies. Sleep, 33(5), 585–592. https://doi.org/10.1093/sleep/33.5.585
4. The Tribune. (2024, March 15). World Sleep Day: India is facing a sleep health crisis, say experts. tribuneindia.com
5. Buysse, D. J. (2014). Sleep health: Can we define it? Does it matter? Sleep, 37(1), 9–17. https://doi.org/10.5665/sleep.3298
6. Sarkar, A., & Pujara, T. (2025). Perceptions of urban environment indicators associated with mental well-being: A stakeholder investigation. Cities & Health, 9(2), 273–297. https://doi.org/10.1080/23748834.2025.2480480
7. Sarkar, A., & Pujara, T. (2025). A conceptual framework for mapping urban environment indicators and mental well-being. Discover Cities, 2(1), 119. https://doi.org/10.1007/s44327-025-00166-z
8. World Health Organization Regional Office for Europe. (2018). Environmental noise guidelines for the European Region. WHO. who.int
9. Basner, M., & McGuire, S. (2018). WHO Environmental Noise Guidelines for the European Region: A systematic review on environmental noise and effects on sleep. International Journal of Environmental Research and Public Health, 15(3), 519. https://doi.org/10.3390/ijerph15030519
10. Falchi, F., Cinzano, P., Duriscoe, D., et al. (2016). The new world atlas of artificial night sky brightness. Science Advances, 2(6), e1600377. https://doi.org/10.1126/sciadv.1600377
11. Chang, A.-M., Aeschbach, D., Duffy, J. F., & Czeisler, C. A. (2015). Evening use of light-emitting eReaders negatively affects sleep, circadian timing, and next-morning alertness. Proceedings of the National Academy of Sciences, 112(4), 1232–1237. https://doi.org/10.1073/pnas.1418490112
12. Minor, K., Bjerre-Nielsen, A., Jonasdottir, S. S., Lehmann, S., & Obradovich, N. (2022). Rising temperatures erode human sleep globally. One Earth, 5(5), 534–549. https://doi.org/10.1016/j.oneear.2022.04.008
13. Hill, T. D., Burdette, A. M., & Hale, L. (2009). Neighborhood disorder, sleep quality, and psychological distress: Testing a model of structural amplification. Health & Place, 15(4), 1006–1013. https://doi.org/10.1016/j.healthplace.2009.04.001
14. Shin, J. C., Parab, K. V., An, R., & Grigsby-Toussaint, D. S. (2020). Greenspace exposure and sleep: A systematic review. Environmental Research, 182, 109081. https://doi.org/10.1016/j.envres.2019.109081
15. Sarkar, A., Gemmell, E., P S, S., Anand, S., Bhattacharya, A. A., & Pujara, T. (2026). Perceived quality and access to urban green spaces and loneliness in India. Cities & Health, 1–17. https://doi.org/10.1080/23748834.2026.2686415
16. Roenneberg, T., Allebrandt, K. V., Merrow, M., & Vetter, C. (2012). Social jetlag and obesity. Current Biology, 22(10), 939–943. https://doi.org/10.1016/j.cub.2012.03.038
17. St-Onge, M.-P., Mikic, A., & Pietrolungo, C. E. (2016). Effects of diet on sleep quality. Advances in Nutrition, 7(5), 938–949. https://doi.org/10.3945/an.116.012336
18. St-Onge, M.-P., Roberts, A., Shechter, A., & Choudhury, A. R. (2016). Fiber and saturated fat are associated with sleep arousals and slow wave sleep. Journal of Clinical Sleep Medicine, 12(1), 19–24. https://doi.org/10.5664/jcsm.5384
19. Buysse, D. J., Reynolds, C. F., Monk, T. H., Berman, S. R., & Kupfer, D. J. (1989). The Pittsburgh Sleep Quality Index: A new instrument for psychiatric practice and research. Psychiatry Research, 28(2), 193–213. https://doi.org/10.1016/0165-1781(89)90047-4
20. Wang, C., & Burris, M. A. (1997). Photovoice: Concept, methodology, and use for participatory needs assessment. Health Education & Behavior, 24(3), 369–387. https://doi.org/10.1177/109019819702400309
21. Evans, J., & Jones, P. (2011). The walking interview: Methodology, mobility and place. Applied Geography, 31(2), 849–858. https://doi.org/10.1016/j.apgeog.2010.09.005
22. Sarkar, A., & Pujara, T. (2025). Exploring the link between perceived urban environments and mental well-being: A case study of Delhi, India. Cities & Health, 9(2), 226–247. https://doi.org/10.1080/23748834.2025.2457847
23. Sarkar, A., & Pujara, T. (2024). Development of an urban environment assessment framework for mental well-being in India using nominal group technique and rank order centroid method. Cities & Health, 9(1), 90–111. https://doi.org/10.1080/23748834.2024.2436708
24. World Health Organization Regional Office for Europe. (2018). Copenhagen Consensus of Mayors: Healthier and happier cities for all. WHO. who.int
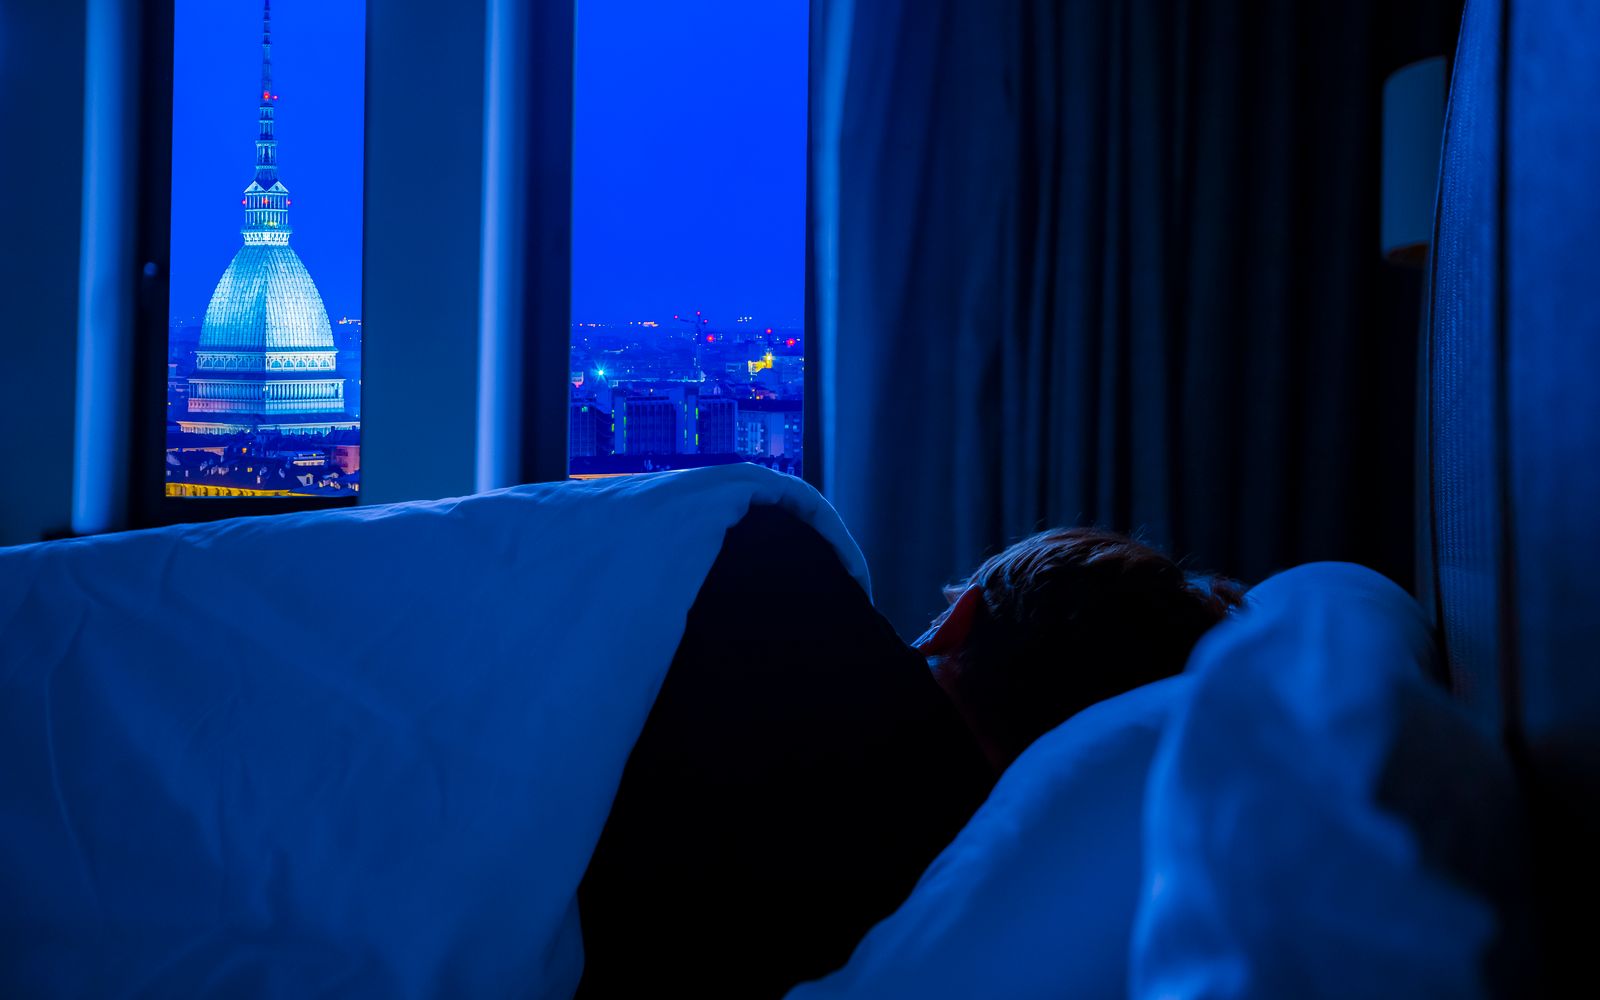
Cover image: a bedroom looking out on a city skyline at night. Photo by Cristian Manieri on Pexels.
Write for UFI
Have a story about cities? We publish articles and photo essays from researchers, practitioners and photographers.
Pitch us at contact@urbanfrontierinsights.com